PyQtGraph 는 PyQt 와 Numpy 를 기반으로 만들어진 과학 그래픽 및 GUI 라이브러리입니다.
Matplotlib 모듈이 정적인 그래프에 적당하다면 PyQtGraph는 실시간 챠트를 그리는데 유용합니다.
- PyQtGraph 설치
pip install pyqtgraph
- PyQtGraph 예제
python -m pyqtgraph.examples
-m 옵션은 모듈을 직접 실행할 때 사용합니다.
63-1 예제: ex62
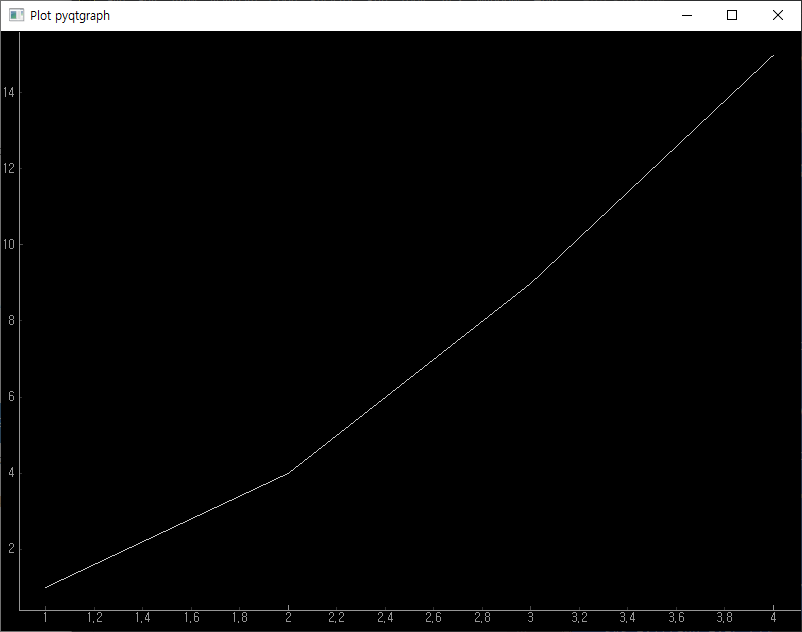
- 기본 그래프 출력
| import sys import pyqtgraph as pg from PyQt5.QtWidgets import QApplication, QMainWindow from PyQt5.QtWidgets import QApplication, QMainWindow class MyApp(QMainWindow): def __init__(self): super().__init__() self.initUI() def initUI(self): plot_widget = pg.PlotWidget() x = [1, 2, 3, 4] y = [1, 4, 9, 15] plot_widget.plot(x, y) self.setCentralWidget(plot_widget) self.setGeometry(300, 300, 800, 600) self.setWindowTitle("Plot pyqtgraph") self.show() if __name__ == "__main__": app = QApplication(sys.argv) win = MyApp() sys.exit(app.exec_()) |
63-2 결과
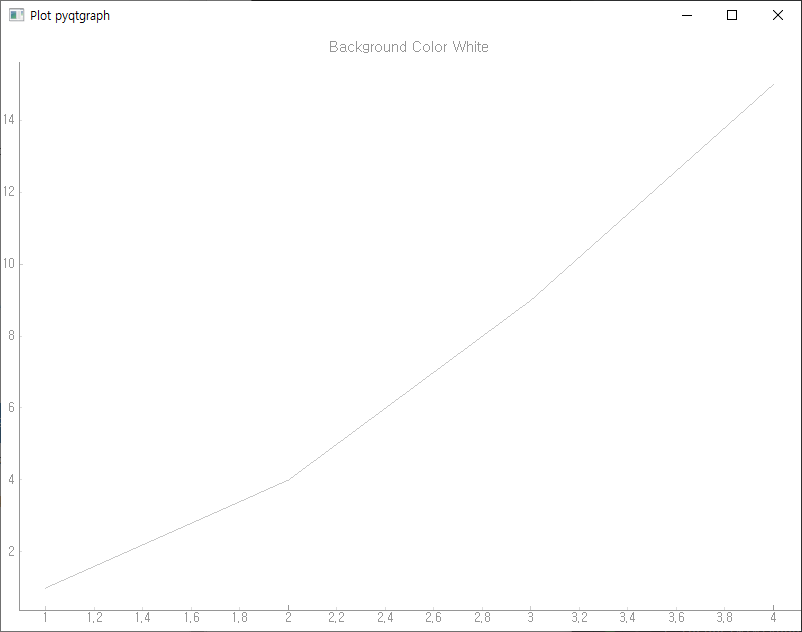
63-3 예제2 : 배경색 변경
| import sys import pyqtgraph as pg from PyQt5.QtWidgets import QApplication, QMainWindow from PyQt5.QtWidgets import QApplication, QMainWindow class MyApp(QMainWindow): def __init__(self): super().__init__() self.initUI() def initUI(self): plot_widget = pg.PlotWidget(title="Background Color White") x = [1, 2, 3, 4] y = [1, 4, 9, 15] plot_widget.plot(x, y) plot_widget.setBackground('w') self.setCentralWidget(plot_widget) self.setGeometry(300, 300, 800, 600) self.setWindowTitle("Plot pyqtgraph") self.show() if __name__ == "__main__": app = QApplication(sys.argv) win = MyApp() sys.exit(app.exec_()) |
63-4 결과
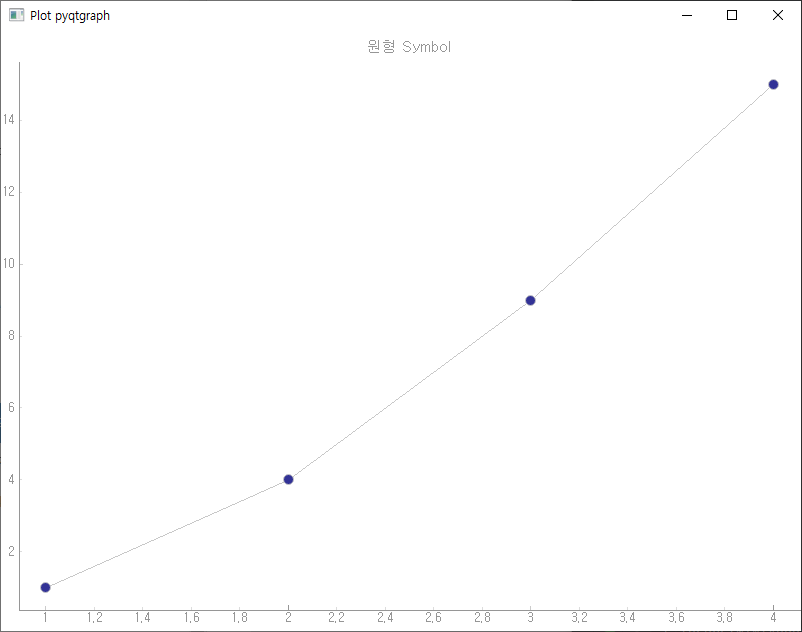
63-5 예제3 : Symbol 추가
| 기호 | 설명 |
| o | 원형 심볼 |
| t | 삼각형 아래 방향 |
| t1 | 삼각형 위 방향 |
| s | 직사각형 심볼 |
| x | x 모양 심볼 |
| import sys import pyqtgraph as pg from PyQt5.QtWidgets import QApplication, QMainWindow from PyQt5.QtWidgets import QApplication, QMainWindow class MyApp(QMainWindow): def __init__(self): super().__init__() self.initUI() def initUI(self): plot_widget = pg.PlotWidget(title="원형 Symbol") x = [1, 2, 3, 4] y = [1, 4, 9, 15] plot_widget.plot(x=x, y=y, symbol='o') plot_widget.setBackground('w') self.setCentralWidget(plot_widget) self.setGeometry(300, 300, 800, 600) self.setWindowTitle("Plot pyqtgraph") self.show() if __name__ == "__main__": app = QApplication(sys.argv) win = MyApp() sys.exit(app.exec_()) |
63-6 결과
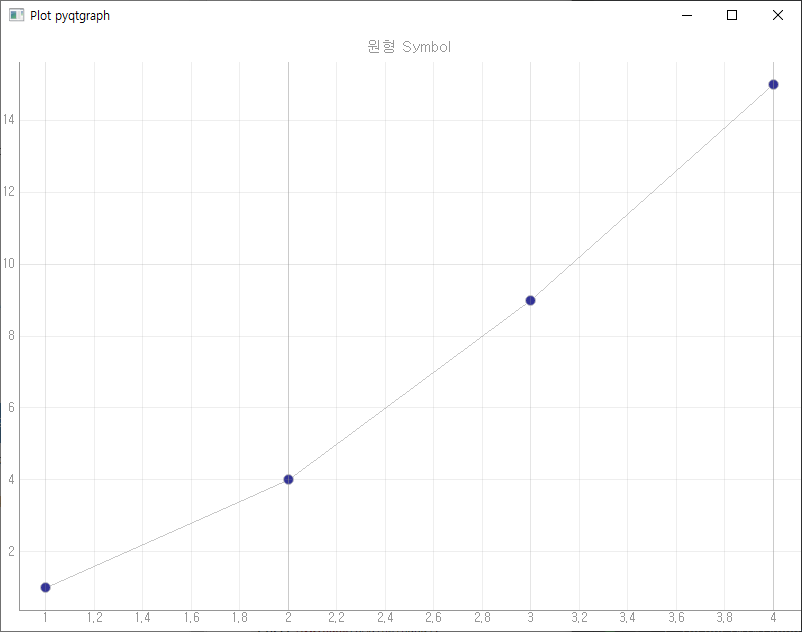
63-7 예제: 격자(Grid) 출력
PlotWidget 객체의 showGrid 메서드를 호출하면 그래프에서 격자를 축 단위로 on/off 할 수 있습니다.
| import sys import pyqtgraph as pg from PyQt5.QtWidgets import QApplication, QMainWindow from PyQt5.QtWidgets import QApplication, QMainWindow class MyApp(QMainWindow): def __init__(self): super().__init__() self.initUI() def initUI(self): plot_widget = pg.PlotWidget(title="원형 Symbol") x = [1, 2, 3, 4] y = [1, 4, 9, 15] plot_widget.plot(x=x, y=y, symbol='o') plot_widget.setBackground('w') plot_widget.showGrid(x=True, y=True) self.setCentralWidget(plot_widget) self.setGeometry(300, 300, 800, 600) self.setWindowTitle("Plot pyqtgraph") self.show() if __name__ == "__main__": app = QApplication(sys.argv) win = MyApp() sys.exit(app.exec_()) |
63-8 결과
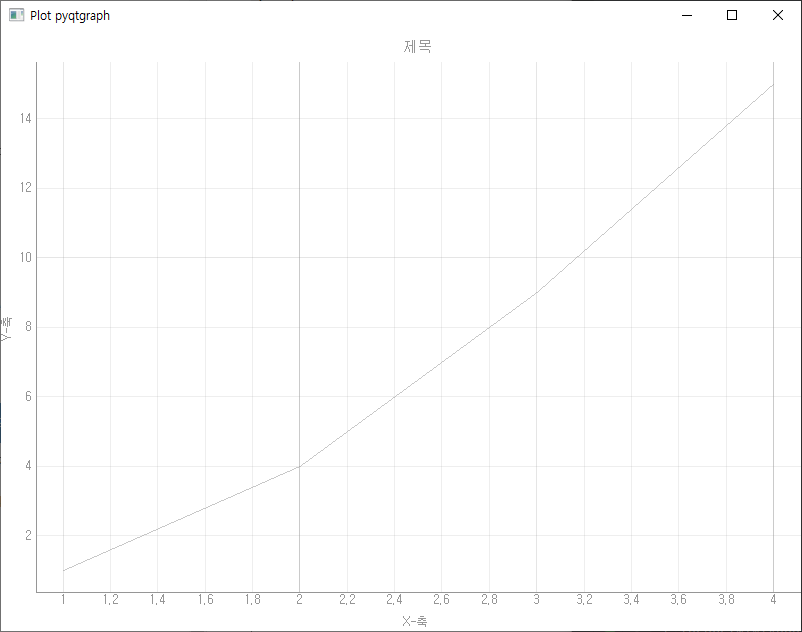
63-9 예제4: Title 과 Label
| import sys import pyqtgraph as pg from PyQt5.QtWidgets import QApplication, QMainWindow from PyQt5.QtWidgets import QApplication, QMainWindow class MyApp(QMainWindow): def __init__(self): super().__init__() self.initUI() def initUI(self): plot_widget = pg.PlotWidget() x = [1, 2, 3, 4] y = [1, 4, 9, 15] # Style plot_widget.setBackground('w') plot_widget.setTitle("제목") plot_widget.setLabel("left", "Y-축") # y-axis plot_widget.setLabel("bottom", "X-축") # x-axis plot_widget.showGrid(x=True, y=True) plot_widget.plot(x, y) self.setCentralWidget(plot_widget) self.setGeometry(300, 300, 800, 600) self.setWindowTitle("Plot pyqtgraph") self.show() if __name__ == "__main__": app = QApplication(sys.argv) win = MyApp() sys.exit(app.exec_()) |
63-10 결과
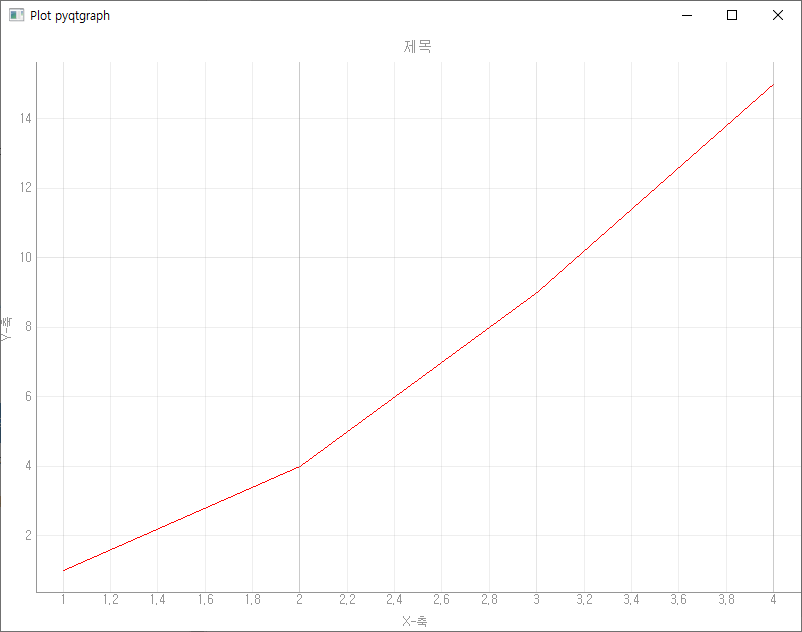
63-11 예제5: Pen
| import sys import pyqtgraph as pg from PyQt5.QtWidgets import QApplication, QMainWindow from PyQt5.QtWidgets import QApplication, QMainWindow class MyApp(QMainWindow): def __init__(self): super().__init__() self.initUI() def initUI(self): plot_widget = pg.PlotWidget() x = [1, 2, 3, 4] y = [1, 4, 9, 15] # Style plot_widget.setBackground('w') plot_widget.setTitle("제목") plot_widget.setLabel("left", "Y-축") # y-axis plot_widget.setLabel("bottom", "X-축") # x-axis plot_widget.showGrid(x=True, y=True) # plot_widget.plot(x, y, pen=(0, 0, 255)) plot_widget.plot(x, y, pen=pg.mkPen('r')) self.setCentralWidget(plot_widget) self.setGeometry(300, 300, 800, 600) self.setWindowTitle("Plot pyqtgraph") self.show() if __name__ == "__main__": app = QApplication(sys.argv) win = MyApp() sys.exit(app.exec_()) |
63-12 결과
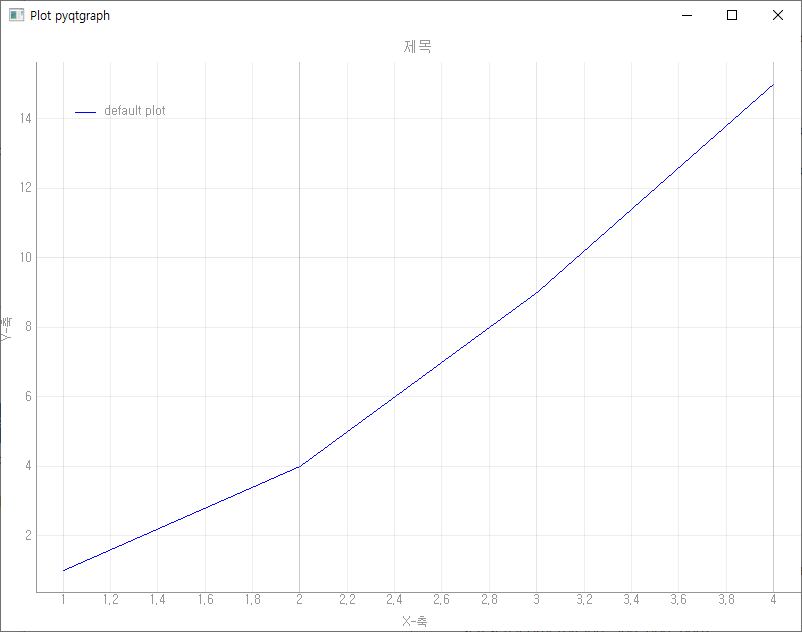
63-13 예제6: legend
legend는 각 그래프를 설명하는 부분을 의미, pyqtgraph에서도 addLegend 메서드를 사용하면 됩니다.
| import sys import pyqtgraph as pg from PyQt5.QtWidgets import QApplication, QMainWindow from PyQt5.QtWidgets import QApplication, QMainWindow class MyApp(QMainWindow): def __init__(self): super().__init__() self.initUI() def initUI(self): plot_widget = pg.PlotWidget() x = [1, 2, 3, 4] y = [1, 4, 9, 15] # Style plot_widget.setBackground('w') plot_widget.setTitle("제목") plot_widget.setLabel("left", "Y-축") # y-axis plot_widget.setLabel("bottom", "X-축") # x-axis plot_widget.showGrid(x=True, y=True) plot_widget.addLegend() plot_widget.plot(x, y, pen=(0, 0, 255), name="default plot") # 기본 도면 self.setCentralWidget(plot_widget) self.setGeometry(300, 300, 800, 600) self.setWindowTitle("Plot pyqtgraph") self.show() if __name__ == "__main__": app = QApplication(sys.argv) win = MyApp() sys.exit(app.exec_()) |
63-14 결과
'프로그래밍 > PyQt5 GUI' 카테고리의 다른 글
| 65. PyQtGraph 시계열 그래프 그리기 (0) | 2021.08.13 |
|---|---|
| 64. PyQtGraph 그래프 두 개 그리기 (0) | 2021.08.13 |
| 62. 주가 챠트 (0) | 2021.08.12 |
| 61. 주식 데이터 (0) | 2021.08.12 |
| 60. 멀티스레딩 (0) | 2021.08.10 |

